
Less than one percent of ballots in Thurston County were rejected during the 2020 general election, the Office of the Washington State Auditor has found.
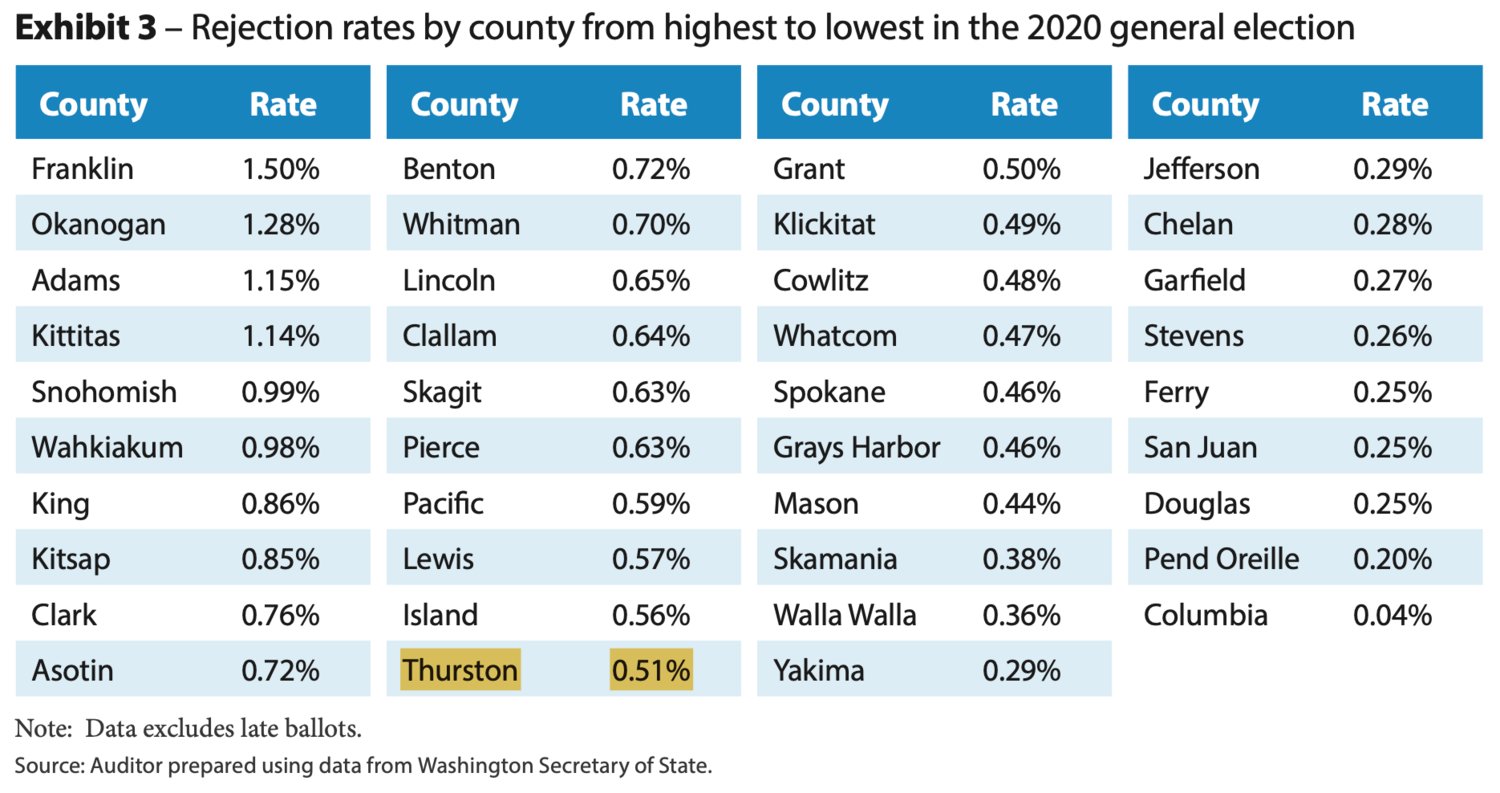
A 69-page report showed that 0.51 percent of Thurston County ballots were rejected in 2020. In comparison, Columbia County had the lowest rejection rate at 0.04 percent while Franklin County logged the highest rate statewide at 1.50 percent.
Washington’s overall ballot rejection rate stood at 0.72 percent or about 30,000 ballots out of some 4.2 million that were cast.
The report did not provide information specific to any county but noted that “counties with lower rejection rates appeared more willing to accept less conclusive signatures.”
State auditors said deciding whether a ballot signature matches the one on file is “inherently subjective and requires some level of human judgment,” which could help explain the differences in rejection rates among different counties.
Demographic attributes
The audit found that black voters were twice as likely to have their ballots rejected than white voters, who saw the lowest rejection rate among six racial and ethnic groups.
The greatest disparity in rejection rates was between white voters at 0.63 percent and black voters at 2.49 percent.
“Disparities in rejection rates for different racial and ethnic groups are unacceptable,” Washington state auditor Pat McCarthy said in the report’s conclusion.
“We explicitly looked for bias in the decisions to accept or reject individual ballots, to see if that could help explain the differences,” she said. “We found no evidence of bias in those decisions. While that is good news, it also means we are not able to explain what causes rejection rates to vary for these groups of voters.”
The audit also found that ballots from younger voters and those with less voting experience were more likely to be rejected.
Washington’s youngest voters were nearly three times more likely to have their ballots rejected than the state’s oldest voters. The rejection rate for first-time voters was also more than five times higher than for those with previous voting experience.
Men were also 42 percent more likely to have their ballots rejected than women, and voters casting non-English ballots had an estimated 47 percent greater likelihood of ballot rejection than those who cast English-language ballots.
State auditors said possible explanations for higher ballot rejection rates included signature inconsistencies, a lack of familiarity with the voting process, name changes, language or cultural barriers, and differences between county election processes.
Despite this, state auditors struggled to find patterns that could account for the differences in rejection rates, suggesting that no single practice is responsible.


Comments
No comments on this item Please log in to comment by clicking here